In our continuing series on the Sabermetric analysis that shapes our player projections in our 2025 Player Projections Draft Advisor. Today we'll take a look at some of the indicators that are defining our 2025 first baseman projections:
Andrew Vaughn Andrew Vaughn's 2024 season confirmed his solid power potential. He posted a HardHit% of 43.1% (league average: 36.5%) and a Barrel% of 9.3% (league average: 7.1%), laying the groundwork for a 2025 projection of 27 home runs and a 14.2% HR/FB rate--up from last year. His plate discipline showed a favorable K% of 21.3% (league average: 22.3%) but a BB% of just 6.1% (league average: 8.6%), leaving some room to improve his walk rate as he eyes 79 RBIs and 65 runs in 2025. Though his batting average last season fell short of his expected mark, that dip hints more at underperformance than lack of ability, as he aims for a .251 clip. A GB/FB ratio of 0.8 (league average: 1.2) paired with a BABIP of .285 (league average: .300) indicates that his profile--with fewer ground balls--should naturally lift his BABIP; any dip probably comes from bad luck rather than poor contact. With limited speed, capped at 2 stolen bases, his counting stats are slightly affected by reduced at-bats, yet the upward trend is clear for a more potent 2025 offensive output. | 2024 BABIP: 0.285(-0.014)| Contact Rate: 80%(2%)| xBA: 0.245(-0.001)| xSLG: 0.449(0.047)| HR Distance: 403ft(9)| HR Max BBS: 112.2()| HardHit 95MPH+%: 43.3%(-3.2%)| Avg Velocity: 90.3(-0.3)|Velo 50%: 100.9(-0.7)| Elevation%: 16.6(5.4)| Barrels%: 9.3%(0.8%)| HR/FB%: 9%(-4%)| GB/FB Rate: 0.8(-0.4)| EYE: 0.29(0.01)| ISO: 15.6%(-1.5%)
Bryce Harper Bryce Harper's 2024 campaign delivered elite power numbers. With a HardHit% of 47.2% (league avg: 36.5%) and a Barrel% of 10.4% (league avg: 7.1%), he's set for a 2025 projection of 30 homers and a boosted HR/FB% of 17.5%. His plate discipline remains sharp, recording a K% of 21.9% (league avg: 22.3%) alongside a BB% of 12.0% (league avg: 8.6%), paving the way for an expected 110 RBIs and 97 runs next season. Although his batting average dipped below his expected xBA last year--an underperformance likely to even out--a projected .277 average in 2025 signals a return to form. Moreover, his 1.0 GB/FB ratio (league avg: 1.2) and BABIP of .331 (league avg: .300) show Harper consistently making solid contact. With a strong foundation and clear power and discipline, Harper is poised to make a significant impact in 2025. | 2024 BABIP: 0.331(-0.021)| Contact Rate: 75%(6%)| xBA: 0.271(-0.014)| xSLG: 0.488(-0.037)| HR Distance: 392ft(-17)| HR Max BBS: 113.8()| HardHit 95MPH+%: 48.2%(1.4%)| Avg Velocity: 91.1(-0.7)|Velo 50%: 102.5(-1.3)| Elevation%: 13.5(4.3)| Barrels%: 10.4%(-4.8%)| HR/FB%: 18%(-2%)| GB/FB Rate: 1.0(-0.5)| EYE: 0.55(-0.12)| ISO: 24.0%(3.4%)
Carlos Santana Carlos Santana's 2024 campaign underscored his power upside. His HardHit% stood at 39.9% (league average: 36.5%) and Barrel% at 7.3% (league average: 7.1%), showing extra-base potential when he fires the ball. He posted a solid Contact% of 78.7% (league average: 75.5%), yet his batting average lagged behind his xBA. Coupled with a BABIP of .252 (league average: .300) and a GB/FB ratio of 0.9 (league average: 1.2), it's clear that his results suffered more from thin luck than poor launch quality. At the plate, his disciplined approach was evident with a K% of 16.7% (league average: 22.3%) and a BB% of 10.9% (league average: 8.6%), which will keep his on-base numbers solid despite limited opportunities. Looking ahead to 2025, projections are a .228 batting average, 21 home runs, 69 RBI, 67 runs, and 4 stolen bases, along with an HR/FB% of 11.5%--a sign of a more measured power approach and a shift toward a conservative launch strategy. | Santana keeps producing despite his advanced age (38), power remains above average with his 12% HR/FB rate. 2024 BABIP: 0.252(-0.003)| Contact Rate: 79%(-1%)| xBA: 0.247(0.009)| xSLG: 0.422(0.002)| HR Distance: 392ft(-4)| HR Max BBS: 113.6()| HardHit 95MPH+%: 39.9%(3.7%)| Avg Velocity: 89.2(0.4)|Velo 50%: 99.5(0.1)| Elevation%: 16.1(3.3)| Barrels%: 7.3%(0.6%)| HR/FB%: 12%(-1%)| GB/FB Rate: 0.9(-0.3)| EYE: 0.66(0.03)| ISO: 18.2%(-0.7%)
Christian Walker Christian Walker's 2024 numbers leave no doubt about his raw power. With a HardHit% of 48.0% (league average: 36.5%) and a Barrel% of 13.3% (league average: 7.1%), he's on track for 32 homers in 2025, bolstered by an uptick to a 16.7% HR/FB rate. Even though his K% sits at 24.1% (league average: 22.3%), his 10.0% BB rate (league average: 8.6%) helps keep him in check by boosting his on-base chances. | 2024 BABIP: 0.287(0.014)| Contact Rate: 76%(1%)| xBA: 0.249(-0.002)| xSLG: 0.465(-0.003)| HR Distance: 407ft(4)| HR Max BBS: 113.9()| HardHit 95MPH+%: 48.0%(7.9%)| Avg Velocity: 91.2(3.2)|Velo 50%: 103.1(2.5)| Elevation%: 16.7(0.8)| Barrels%: 13.3%(2.1%)| HR/FB%: 16%(0%)| GB/FB Rate: 0.8(0.0)| EYE: 0.41(-0.07)| ISO: 21.7%(-2.2%)
Freddie Freeman Freddie Freeman's 2024 numbers show a batter ready to step it up in 2025. His HardHit% of 41.6% (league average: 36.5%) and Barrel% of 9.1% (league average: 7.1%) point to serious power, paving the way for a projection of 24 home runs and a boosted HR/FB% of 14.5%. His disciplined approach is evident: a K% of 15.7% (league average: 22.3%) and a BB% of 12.2% (league average: 8.6%) set him up for 99 RBIs and 93 runs. Although a GB/FB ratio of 1.0 (league average: 1.2) leans toward fly balls, his BABIP of .306 (league average: .300) stayed near norm--mirroring how his actual average tracked his xBA last season--which backs a projected .274 average. While his style limits his speed (expect 9 stolen bases), Freeman is poised to keep making a big offensive impact next season. | 2024 BABIP: 0.306(-0.064)| Contact Rate: 82%(1%)| xBA: 0.281(-0.001)| xSLG: 0.477(0.001)| HR Distance: 394ft(-6)| HR Max BBS: 112.3()| HardHit 95MPH+%: 41.8%(0.0%)| Avg Velocity: 89.4(-0.6)|Velo 50%: 100.3(-0.2)| Elevation%: 14.3(-0.8)| Barrels%: 9.1%(-2.0%)| HR/FB%: 13%(-2%)| GB/FB Rate: 1.0(0.0)| EYE: 0.78(0.18)| ISO: 19.4%(-4.2%)
Jake Bauers Jake Bauers flashed power last season with a HardHit% of 41.8% (league avg: 36.5%) and a Barrel% of 10.3% (league avg: 7.1%), proving he can drive the ball into gaps. Yet, his batting average fell short of his xBA. He's aggressive at the plate with a BB% of 11.3% (league avg: 8.6%), but that approach is countered by a K% of 34.1% (league avg: 22.3%). His batted-ball profile--a GB/FB ratio of 0.6 versus 1.2 and a BABIP of .279 against a .300 average--indicates that even his hard contact isn't paying dividends, likely due to pitch selection and timing issues. Heading into 2025, with projections of a .219 AVG, 15 HR, 50 RBI, 61 R, 17 SB, and an improved HR/FB% of 13.8%, the challenge remains turning raw power into consistent production while tightening plate discipline and maximizing limited at-bats. | 2024 BABIP: 0.279(0.011)| Contact Rate: 73%(3%)| xBA: 0.204(0.005)| xSLG: 0.390(0.029)| HR Distance: 401ft(5)| HR Max BBS: 110.1()| HardHit 95MPH+%: 42.9%(-5.1%)| Avg Velocity: 89.4(0.3)|Velo 50%: 100.0(-2.0)| Elevation%: 22.6(8.9)| Barrels%: 10.3%(-8.3%)| HR/FB%: 13%(-5%)| GB/FB Rate: 0.6(-0.3)| EYE: 0.33(0.05)| ISO: 16.2%(-4.8%)
Josh Naylor Josh Naylor's season displays his burgeoning power with a HardHit% of 40.8% (league average: 36.5%) and a Barrel% of 8.4% (league average: 7.1%), backing his 2025 projection of 26 homers and 84 RBI. His plate discipline is sharp--a K% of 16.6% (league average: 22.3%) and a BB% of 9.2% (league average: 8.6%)--setting him up to take extra-base chances, even if his limited at-bats last season held back his counting stats. Although his batting average tapered below his xBA, a bounce back to .260 is on the horizon thanks to his solid contact skills. His batted ball profile, with a GB/FB ratio of 1.3 (league average: 1.2) and a BABIP of .246 (league average: .300), suggests that his low BABIP is more about bad luck than weak fly balls. This further supports the expected climb in his HR/FB% to 16.0% in 2025, which feeds into projected totals of 77 runs and 6 stolen bases as he refines his offensive game. | 2024 BABIP: 0.246(-0.080)| Contact Rate: 79%(-3%)| xBA: 0.257(0.014)| xSLG: 0.448(-0.008)| HR Distance: 399ft(1)| HR Max BBS: 110.9()| HardHit 95MPH+%: 40.9%(0.0%)| Avg Velocity: 89.9(0.8)|Velo 50%: 100.8(0.2)| Elevation%: 11.0(-1.3)| Barrels%: 8.4%(0.2%)| HR/FB%: 19%(7%)| GB/FB Rate: 1.3(0.1)| EYE: 0.55(0.07)| ISO: 21.3%(3.2%)
Nathaniel Lowe Lowe's 2024 numbers show a guy built on contact and patience. His HardHit% of 39.5%--compared to the league's 36.5%--yielded quality fly balls, even though his Barrel% at 5.8% trails the league's 7.1%. The potential for more power is clearly there. His disciplined approach at the plate is evident: a K% of 22.1% versus 22.3% and a BB% of 12.6% compared to 8.6% boosted his on-base skills, even if his batting average fell short of his xBA. A GB/FB ratio of 1.6 (league average: 1.2) is lifting his BABIP to .324 (league average: .300), showing that extra bases come once he makes contact. Looking to 2025, Lowe is projected to hit .273 with 17 home runs, 74 RBIs, 75 runs, 2 stolen bases, and a HR/FB% of 14.0%--a sign that refining his swing could unlock even more power. | 2024 BABIP: 0.324(-0.005)| Contact Rate: 81%(-1%)| xBA: 0.254(-0.011)| xSLG: 0.386(-0.015)| HR Distance: 394ft(-5)| HR Max BBS: 111.8()| HardHit 95MPH+%: 40.0%(-1.4%)| Avg Velocity: 88.9(-0.9)|Velo 50%: 100.4(-0.7)| Elevation%: 7.7(0.5)| Barrels%: 5.8%(-0.8%)| HR/FB%: 15%(3%)| GB/FB Rate: 1.6(0.0)| EYE: 0.57(0.00)| ISO: 13.6%(-1.7%)
Alex Kirilloff Alex Kirilloff's 2024 season showcased some genuine power with a HardHit% of 40.9% (league: 36.5%) and a Barrel% of 11.3% (league: 7.1%). His K% of 26.4% (league: 22.3%) and BB% of 8.4% (league: 8.6%) point to some needed work on plate discipline, and his batting average lagged behind what his power numbers suggested. With a GB/FB ratio of 1.2 (league: 1.2) and a BABIP of .245 (league: .300), it's clear there's quality contact mixed with a bit of sticky luck. All this, plus a possible limit on at-bats, backs up his 2025 projection: a .235 average, 4 homers, 14 RBIs, 18 runs, no stolen bases, and an HR/FB% of 14.5%--an uptick in pop rate that builds on his proven hard-hit potential. | 2024 BABIP: 0.245(-0.063)| Contact Rate: 72%(-10%)| xBA: 0.218(0.017)| xSLG: 0.425(0.041)| HR Distance: 387ft(-16)| HR Max BBS: 107.1()| HardHit 95MPH+%: 40.9%(-4.6%)| Avg Velocity: 91.3(2.0)|Velo 50%: 100.3(0.7)| Elevation%: 13.2(7.1)| Barrels%: 11.3%(4.9%)| HR/FB%: 11%(2%)| GB/FB Rate: 1.2(-0.6)| EYE: 0.32(0.18)| ISO: 18.2%(7.1%)
Matt Olson Matt Olson's 2024 slate shows elite power potential: a HardHit% of 47.4% (league avg: 36.5%) and a Barrel% of 12.4% (league avg: 7.1%), setting the stage for his projected 30 homers in 2025. His plate discipline--24.8% K (league avg: 22.3%) paired with a 10.4% BB (league avg: 8.6%)--proves that while he strikes out more, his patience fuels run production, as seen in the expected 96 RBIs and 82 runs. Though his batting average dipped below his xBA last season, coupled with a BABIP of .293 (league avg: .300), it's likely bad luck rather than poor contact, especially with his strong HardHit% and a low GB/FB ratio of 0.8 (league avg: 1.2) that favors fly balls. These factors carry into his 2025 outlook, with an expected batting average of .257 and an HR/FB% of 17.3%, underscoring Olson's evolution into a formidable, run-producing, hard-hitting corner infielder. | 2024 BABIP: 0.293(-0.009)| Contact Rate: 77%(2%)| xBA: 0.249(0.002)| xSLG: 0.454(-0.003)| HR Distance: 403ft(-8)| HR Max BBS: 113.9()| HardHit 95MPH+%: 47.4%(-7.7%)| Avg Velocity: 91.5(-2.2)|Velo 50%: 102.7(-2.1)| Elevation%: 16.1(0.0)| Barrels%: 12.4%(-4.0%)| HR/FB%: 16%(-12%)| GB/FB Rate: 0.8(-0.1)| EYE: 0.42(-0.21)| ISO: 21.0%(-11.1%)

Patrick Wisdom Patrick Wisdom showcased his power potential in 2024 with a HardHit% of 48.5% (league average: 36.5%) and a Barrel% of 15.8% (league average: 7.1%), setting the stage for more extra-base hits despite his contact quirks. His plate discipline needs work, as evidenced by a K% of 33.9% (league average: 22.3%) and a BB% of 5.7% (league average: 8.6%), which dragged his batting average below his xBA. Moreover, a GB/FB ratio of 0.4 (league average: 1.2) combined with a BABIP of .207 (league average: .300) suggests his struggles came more from bad luck than weak ground-ball contact. Looking ahead to 2025, projections adjust his output to a .205 average with 20 home runs, 38 RBI, 46 runs, and 9 stolen bases, along with a climb in HR/FB% to 20.4% as Wisdom works to leverage his elite hard-contact ability despite ongoing plate discipline issues and limited playing time affecting his counting stats. | 2024 BABIP: 0.207(-0.031)| Contact Rate: 71%(2%)| xBA: 0.185(0.014)| xSLG: 0.425(0.033)| HR Distance: 415ft(10)| HR Max BBS: 112.7()| HardHit 95MPH+%: 48.5%(-6.2%)| Avg Velocity: 90.9(-1.8)|Velo 50%: 102.1(-1.3)| Elevation%: 28.0(6.3)| Barrels%: 15.8%(-3.7%)| HR/FB%: 12%(-16%)| GB/FB Rate: 0.4(-0.2)| EYE: 0.17(-0.10)| ISO: 22.2%(-7.3%)
Pete Alonso Pete Alonso's 2024 season was a power showcase. He posted a HardHit% of 45.9%--way above the league's 36.5%--and his Barrel% hit 13.0%, nearly double the 7.1% average. That power surge underpins his projected 33 home runs in 2025 and a jump in HR/FB% to 18.7%. His plate discipline remains mixed, with a K% of 24.7% (league average: 22.3%) balanced by a BB% of 10.1% (league average: 8.6%), keeping his on-base numbers up despite a batting average below his xBA. His GB/FB ratio sits at 1.0 (league average: 1.2), yet his BABIP of .276 (league average: .300) points to luck and situational factors rather than poor contact. With only 3 stolen bases reflecting limited speed, the 2025 outlook stands at a .243 average, 103 RBIs, and 86 runs--a season marked by increased power and a sharper plate approach. | 2024 BABIP: 0.276(0.071)| Contact Rate: 77%(1%)| xBA: 0.246(0.006)| xSLG: 0.470(0.011)| HR Distance: 409ft(-1)| HR Max BBS: 116.3()| HardHit 95MPH+%: 46.4%(6.5%)| Avg Velocity: 89.8(0.3)|Velo 50%: 102.8(0.4)| Elevation%: 14.4(-3.7)| Barrels%: 13.0%(-1.8%)| HR/FB%: 18%(-5%)| GB/FB Rate: 1.0(0.2)| EYE: 0.41(-0.02)| ISO: 21.9%(-6.8%)
Anthony Rizzo Rizzo's approach from last season spells out his 2025 projection. His HardHit% sits at 32.8% (league average: 36.5%) and Barrel% at 4.0% (league average: 7.1%), pointing to untapped power and setting the stage for an estimated 15 homers with an improved HR/FB% of 13.4%--a small boost from last year. His disciplined plate work shows with a K% of 17.3% (league average: 22.3%) and a BB% of 7.2% (league average: 8.6%), which will be vital as he looks to elevate his overall game despite his batting average consistently lagging his expected xBA. A GB/FB ratio of 1.3 (league average: 1.2) suggests a slight lean toward grounders, and a BABIP of .259 (league average: .300) indicates that his lower hit rate isn't due to poor contact but just some bad breaks. Adjustments in playing time have limited his counting stats, and the 2025 outlook--a .238 average, 49 RBI, and 47 runs--signals an evolving role where every at-bat matters. | Hard Hit rates are declining (only 33% last season), so everything from power to BA is on the decline for the soon to be 35 year old Rizzo. 2024 BABIP: 0.259(-0.039)| Contact Rate: 83%(5%)| xBA: 0.239(0.011)| xSLG: 0.346(0.011)| HR Distance: 390ft(13)| HR Max BBS: 110.7()| HardHit 95MPH+%: 33.2%(-4.0%)| Avg Velocity: 86.7(-3.3)|Velo 50%: 97.8(-1.4)| Elevation%: 14.3(-3.5)| Barrels%: 4.0%(-2.8%)| HR/FB%: 8%(-2%)| GB/FB Rate: 1.3(0.4)| EYE: 0.42(0.05)| ISO: 10.7%(-2.7%)
Rowdy Tellez Rowdy Tellez's 2024 profile cuts a confident picture. His HardHit% sits at 36.5%--exactly the league average--but his Barrel% of 8.0% tops the league's 7.1%, showing that he makes his hard contact count. His plate discipline is solid, with a K% of 21.1% compared to 22.3% league-wide, though his BB% of 7.4% trails the 8.6% average, hinting at some caution at the plate. A batting average that fell short of his xBA, along with a BABIP of .280 versus .300 and a GB/FB ratio of 0.9 over the 1.2 average, suggests his production issues stem from less-than-ideal batted-ball distribution and fewer opportunities. The 2025 projections--.236 batting average, 14 home runs with an HR/FB% of 12.3% (a notable adjustment), 44 RBI, 37 runs, and 1 stolen base--build on these trends. Increased playing time should allow his premium barrel production to translate into reliable power while he keeps strikeouts low and contact efficient. | 2024 BABIP: 0.280(0.031)| Contact Rate: 79%(-1%)| xBA: 0.236(-0.007)| xSLG: 0.397(0.005)| HR Distance: 409ft(11)| HR Max BBS: 115.5()| HardHit 95MPH+%: 36.5%(-3.5%)| Avg Velocity: 89.4(-0.5)|Velo 50%: 100.6(-0.6)| Elevation%: 17.0(1.8)| Barrels%: 8.0%(-0.7%)| HR/FB%: 10%(-3%)| GB/FB Rate: 0.9(0.0)| EYE: 0.35(-0.06)| ISO: 14.9%(-1.2%)
Ryan Mountcastle Ryan Mountcastle's previous season showcased his raw power. He posted a HardHit% of 45.2% (league average: 36.5%) and a Barrel% of 8.8% (league average: 7.1%), underscoring his extra-base potential--even though his batting average trailed behind his expected mark. His plate discipline still needs work, evidenced by a K% of 22.5% (league average: 22.3%) and a BB% of 5.3% (league average: 8.6%), which shows his on-base skills suffered from a free-swinging approach. Meanwhile, a GB/FB ratio of 1.3 (league average: 1.2) and a BABIP of .327 (league average: .300) indicate that his quality contact usually leads to favorable outcomes. All these metrics support the 2025 projection: a .262 batting average, 23 home runs, 87 RBI, 73 runs, and 3 stolen bases, with an expected rise in HR/FB% to 16.7% fueling his continued power development. | 2024 BABIP: 0.327(0.012)| Contact Rate: 77%(2%)| xBA: 0.275(0.004)| xSLG: 0.455(0.030)| HR Distance: 398ft(-18)| HR Max BBS: 113.5()| HardHit 95MPH+%: 45.2%(0.6%)| Avg Velocity: 90.8(-0.6)|Velo 50%: 102.1(-0.1)| Elevation%: 10.4(-1.6)| Barrels%: 8.8%(-3.3%)| HR/FB%: 10%(-5%)| GB/FB Rate: 1.3(0.1)| EYE: 0.24(-0.11)| ISO: 15.4%(-2.8%)
Spencer Torkelson Spencer Torkelson boasted a HardHit% of 39.3% in 2024 (league avg: 36.5%), showcasing his knack for driving the ball with power. His 2025 projection of 26 home runs and an HR/FB% of 13.5% builds on that solid, above-average contact. His Barrel% at 6.7% (league avg: 7.1%) shows he hasn't yet maximized the extra-base potential from his hard contact--an area ripe for improvement. Torkelson's K% of 27.6% (league avg: 22.3%) outpaces his BB% of 8.7% (league avg: 8.6%), suggesting a tweak to his approach could boost his on-base numbers and close the gap between his batting average and last season's xBA. With a GB/FB ratio of 0.7 (league avg: 1.2), his fly ball tendency supports his power profile, while a BABIP of .285 (league avg: .300) underscores that his 2024 numbers were a function of limited chances rather than a lack of talent--setting up a 2025 campaign of 70 RBI, 70 runs, and 3 stolen bases. | 2024 BABIP: 0.285(0.016)| Contact Rate: 76%(-2%)| xBA: 0.211(-0.008)| xSLG: 0.355(-0.019)| HR Distance: 405ft(5)| HR Max BBS: 109.0()| HardHit 95MPH+%: 39.7%(-10.8%)| Avg Velocity: 89.0(-2.8)|Velo 50%: 99.7(-3.0)| Elevation%: 20.2(3.1)| Barrels%: 6.7%(-7.4%)| HR/FB%: 8%(-7%)| GB/FB Rate: 0.7(-0.1)| EYE: 0.31(-0.08)| ISO: 15.5%(-5.8%)
Triston Casas Triston Casas showed off his power last season with a HardHit% of 45.2% (league: 36.5%) and a Barrel% of 13.3% (league: 7.1%). With 24 homers on tap for 2025 and an HR/FB% climbing to 18.4%, his power threat is only growing. That said, his plate discipline hurt him--registering a K% of 31.7% (league: 22.3%) and a BB% of 12.3% (league: 8.6%)--which helped explain why his batting average lagged behind his xBA. His batted-ball profile--a GB/FB ratio of 1.1 (league: 1.2) and a BABIP of .311 (league: .300)--shows he makes hard, solid contact, yet limited opportunities have kept his counting stats in check. The 2025 projection stands at a .238 average, 82 RBI, and 70 runs, marking a clear shift towards power and run production despite a lack of stolen bases. | 2024 BABIP: 0.311(-0.005)| Contact Rate: 69%(-6%)| xBA: 0.220(-0.021)| xSLG: 0.457(-0.005)| HR Distance: 389ft(-16)| HR Max BBS: 112.0()| HardHit 95MPH+%: 45.2%(-1.0%)| Avg Velocity: 90.2(-0.9)|Velo 50%: 101.4(-1.2)| Elevation%: 10.5(-5.2)| Barrels%: 13.3%(0.2%)| HR/FB%: 25%(6%)| GB/FB Rate: 1.1(0.2)| EYE: 0.39(-0.17)| ISO: 22.2%(-0.4%)
Vinnie Pasquantino Vinnie Pasquantino's 2024 numbers show his untapped power, boasting a HardHit% of 45.8% versus the 36.5% league average. His Barrel% sits squarely at 7.1%--exactly on par with the league--and sets the stage for his projected 2025 jump to 32 home runs with an HR/FB% of 15.3%, proving he can drive the ball harder and more often. | 2024 BABIP: 0.265(0.015)| Contact Rate: 87%(3%)| xBA: 0.266(0.004)| xSLG: 0.443(-0.003)| HR Distance: 397ft(2)| HR Max BBS: 112.2()| HardHit 95MPH+%: 46.5%(6.4%)| Avg Velocity: 91.0(1.7)|Velo 50%: 101.0(1.0)| Elevation%: 14.6(-2.8)| Barrels%: 7.1%(-0.4%)| HR/FB%: 10%(0%)| GB/FB Rate: 0.9(0.1)| EYE: 0.56(-0.24)| ISO: 18.3%(-0.7%)
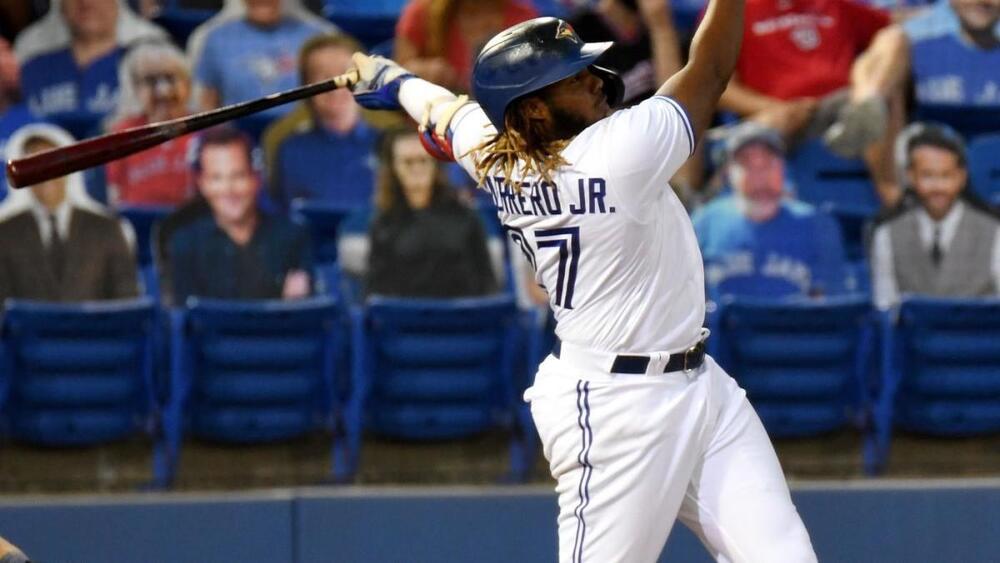
Vladimir Guerrero Jr. Vladimir Guerrero Jr. showcased elite power last season. His HardHit% of 54.8% (league avg: 36.5%) and Barrel% of 13.7% (league avg: 7.1%) put him on track for a 2025 projection of 38 homers and an HR/FB% jumping to 22.0%, signaling a boost in extra-base power. His disciplined approach is evident--K% at 13.8% (league avg: 22.3%) and BB% at 10.3% (league avg: 8.6%) pave the way for a projected .291 average, especially as his actual batting average last season nearly matched his xBA. Add in a slightly elevated GB/FB ratio of 1.4 (league avg: 1.2) and a BABIP of 0.342 (league avg: 0.300), and it's clear the extra-base hits stem from quality contact, not luck. With 119 RBI, 94 runs, and 4 stolen bases, Guerrero's underlying approach is set to make a significant impact in 2025. | 2024 BABIP: 0.342(0.065)| Contact Rate: 80%(1%)| xBA: 0.323(0.000)| xSLG: 0.576(0.032)| HR Distance: 412ft(9)| HR Max BBS: 117.6()| HardHit 95MPH+%: 54.9%(5.7%)| Avg Velocity: 93.8(1.7)|Velo 50%: 105.7(1.6)| Elevation%: 7.4(-3.1)| Barrels%: 13.7%(2.7%)| HR/FB%: 17%(3%)| GB/FB Rate: 1.4(0.1)| EYE: 0.75(0.08)| ISO: 22.1%(4.1%)
Yandy Diaz Yandy Diaz's 2024 numbers firmly established his power potential. A HardHit% of 48.5% versus a league average of 36.5% and a Barrel% of 7.6% over the league's 7.1% set the stage for a bold 2025 projection: 21 homers with a 16.4% HR/FB rate. His disciplined approach--15.3% K (league 22.3%) and 8.1% BB (league 8.6%)--has kept him in line at the plate, with his batting average tracking closely with his xBA, supporting a projected .272 mark. Meanwhile, a GB/FB ratio of 2.0 compared to 1.2 league-wide, paired with a BABIP of .314 versus .300, shows that while he turns out more ground balls, he's still converting a solid number into hits rather than falling short. And though his counting stats have historically limited his opportunities, his overall package points to 58 RBIs and 64 runs in 2025--even if stolen bases remain off the table. | 2024 BABIP: 0.314(-0.053)| Contact Rate: 87%(4%)| xBA: 0.280(-0.001)| xSLG: 0.429(0.015)| HR Distance: 395ft(-9)| HR Max BBS: 117.4()| HardHit 95MPH+%: 48.7%(-5.3%)| Avg Velocity: 92.2(-1.2)|Velo 50%: 103.4(-0.8)| Elevation%: 5.0(-0.7)| Barrels%: 7.6%(-1.8%)| HR/FB%: 11%(-7%)| GB/FB Rate: 2.0(0.1)| EYE: 0.53(-0.17)| ISO: 13.3%(-5.9%)