Those that took our advice on UMA last season, likely capitalized on the devaluation of pitchers. Fortunately for us the same situation is developing in many drafts across the country. This devaluation on the top end also causes a devaluation of the breakout type pitchers. Let's take a look at the concept of valuation between hitters and pitchers using updated data.
First we'll look at the argument on why Hitters deserve more value than Pitchers:
1. Hitters are more predictable than Pitchers. True...but let's try to quantify how much more valuable. Below are a series of charts showing how reliable each position's players are in replicating production from one year to the next. The baseline for this analysis is fantasy value based on a typical 5x5 league that starts (1 C, 1 1B, 1 2B, 1 3B, 1 SS, 1 MI, 1 CI, 1 UT, 6 SP, 3 RP). The 3 columns show the % of players at each position that came within 20%/35%/50% of their previous season's fantasy value. The last column shows, how much value the top 50% of each position lost the following season. And yes, with few exceptions, the top half of players at each and every position will lose value the following season. The goal is to minimize that loss among the top 1/2 and get undervalued players to make up that difference.
Let me start off by saying that the results you see on a yearly basis are less than a valid sample size on a position by position basis. We are looking at the typical number of starters at each position, and to see that the top 1/2 of 1st baseman (12) in 2006 lost 54% of their value, one must keep in mind that a couple of season ending injuries can adversely affect the whole group. We'll get a clearer picture when we combine the last 3 years in accumulation (down further below), while also combining all of the hitters and compare them to pitchers as the sample sizes (N) will then be considered satisfactory. We are also going to ignore relief pitchers for this exercise.
In observing the first year (2006 compared to 2007) of this study we see that the top half of a typical league's Starting Pitchers didn't fair too poorly against other positions (25% loss in fantasy value). The top half of 3rd baseman, Shortstops, and 1st baseman all lost more value. If you are wondering why catchers only lost a pedestrian 16% of value, consider that we are only looking at a small set (the top 6 in this case) and outside of the top 2 or 3, most catchers have minimal value. So in essence there isn't much room to fall.
In observing the second year (2007 compared to 2008) of this study, outside of 1st baseman, we see the top 1/2 of Starting Pitchers losing a very similar amount (-37%) of fantasy value to the other positions.
In observing the third season and the most recent (2008 into 2009), we see a bigger disparity between Starting Pitchers and other positions. Only third baseman lost more value that the top half of pitchers. Which bodes well for the hitter over pitcher argument. But let's now look at the 3 year average (below) which increases the sample size, giving us a more valid and rounded indicator.
In observing the 3 year average: The top half of Starting Pitchers (36 each season from 2006-2008, 108 in total) lost 36% of their value the following season. While the top half of position players (78 each season from 2006-2008, 236 in total) lost 28%. Hmmm....suddenly we are starting to see that there really isn't as big of a disparity on pitcher predictability as we might have thought. 36% percent loss, verses 28% loss, an 8% incremental difference.
Now let's look at the augment on why pitchers deserve more value:
2. A starting pitcher's contribution factor offers 21% more incremental value than that of a hitter. Follow me here with some simple starting roster math: 14 hitters / 9 pitchers is the typical split in most formats. 14 hitters for 5 rotisserie hitting categories, 9 pitchers for 5 Rotisserie pitching categories. Of those 9 pitchers, 6 are typically starting pitchers with 3 dedicated to the relief role. Closers typically log 1/3 the innings of a starter, so it would take 3 closers to contribute the same way as a starter in terms of Wins/WHIP/ERA/K. So in total there are essentially 7 full role positions on the pitching side that contribute to 5 scoring categories. If we exclude Saves, we have 7 theoretical pitchers that contribute to 4 categories (4/7= .57), or on average each of the 7 pitchers contributes 14% (1/7) to each category.
14 hitters contribute to 5 categories (5/14 = .36), or on average each of the 14 hitters contributes 7% (1/14) to each category.
In other words it's a lot easier for a pitcher to influence one of the scoring categories than is it for a hitter...a lot easier. Using the simple math factor (.57 - .36 = 21%). Thus each pitcher's contribution factor accounts for 21% more incremental value than that of a hitter. This is an argument on why pitchers should be evaluated at a higher valuation than hitters.
Now let's compare the two arguments:
3. Comparing 1 & 2: All we are trying to do is intuitively determine what a pitchers weight should be verses that of a hitter. To recap, 1. The top half of the typical fantasy roster's Hitters produce 8% more value than the top half of Starting Pitchers. Which means that they are easier to predict and offer slightly less risk. The 2. Starting Pitcher's slot offers 21% more incremental value than that of the hitter based on the limits of the starting rosters. Using simple deduction, then top tier pitchers should be valued at least as equally as top tier hitters, if anything the analysis leans more towards pitchers being more valuable (21% verses 8%). I'm not saying that we should combine the two as the 2 percentages are from different origin, but clearly the lack of predictably on the pitcher's side (8% less) is not enough to offset the impact that each starting pitcher has on a typical fantasy roster (21% more).
So how is it that pitchers are being discounted so greatly?!? The forces of an open market determined by consumer sentiment. And we know that consumer sentiment in the market place and fundamental value are sometimes two completely different topics. My favorite financial lesson in graduate school was learning about the Dutch Tulip trade of the early 18th century. A relatively worthless commodity trading at insane prices. In a less extreme scenario, hitters are being overvalued at the expense of pitchers without fundamental justification. And it's my obligation as your fantasy advisor to bring this to your attention, and offer a plan to capitalize from it.
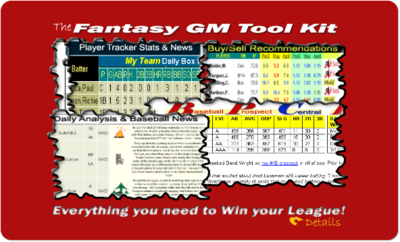
The best part is that the plan is already calculated for you in our player projections software. What makes our software unique are the algorithms that produce truly custom results based on your specific league setup while also also computing the true value of players. For those who play in a serpentine draft, you will see the Average Draft position of these players verses our VAM ranking. In some cases, you'll be able to determine if you should wait a round before capitalizing. As an example, it's the 7th round and the Top 100 VAM ranking within the software is recommending a pitcher who has a 10th round ADP, it might be wise to take a chance and wait another round or two before selecting the player. Last year, in one of my drafts, I snagged Felix Hernandez in the 7th round. The community was drafting him (ADP) in the 8th round, and VAM was recommending him in the 6th round. Not only did he produce like a 1st round talent, but I also saved an additional round for another talent.
For those in auction leagues, we compute the Expected Auction Value ($EAV) or Inflation adjusted Value (INF$). Similarly, these valuations may be slightly above what the market perceives as value for starting pitchers. It will be in your hands to capitalize on the market's weakness and possibly acquire the talent at a discount. An example would be a pitcher which the software computes to have an EAV$ of $20. The live auction is nearing a final bidding of $13, you perceive the value and jump and grab the player at $14. A $6 bargain. Last year, in some of my drafts I picked up Brandon Webb for $20, Dan Haren for 18, James Shields for 15, Felix Hernandez for 16, Chris Carpenter for 11, Clayton Kershaw for 10, and Ubaldo Jiminez for 5. Webb of course was a bust due to the injury, but despite his selection my pitching was dominant in every league I played in....so much so that it carried these teams into the playoffs.
This isn't to say that I don't pay for hitting, because I do... to the tune of 68-70% of my auction budget....but premier starting pitching at Walmart pricing should be embraced!
Anthony A. Perri
Statistician and Publisher - Fantistics
PS - To see the impact that each player will have on your team scoring setup, built into the player projections software is an Impact grid:
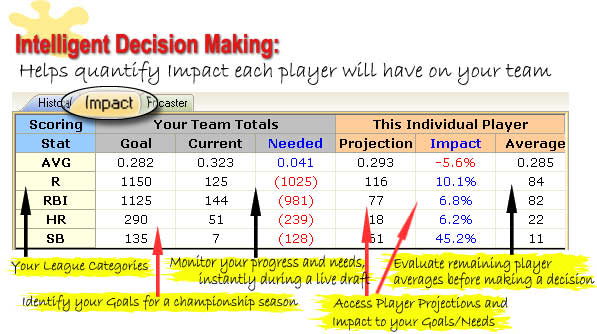
![]()
![]()
![]()